


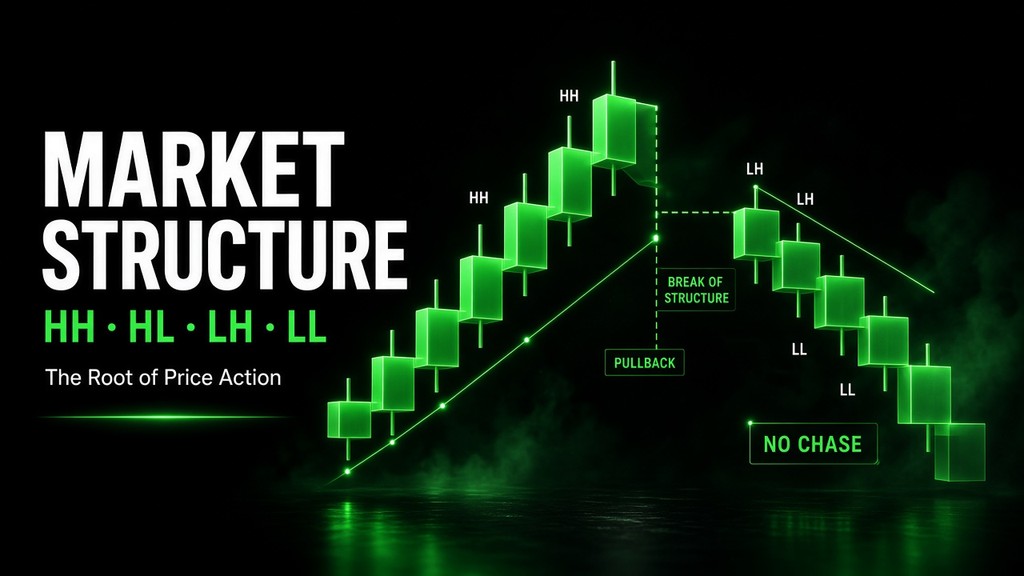
Market structure is the root of price action. Indicators, “advanced psychology,” and fancy strategies sit on top of it. If the foundation is weak, everything built on it wobbles — especially on a funded account, where one bad entry location can wipe days of good work.
This guide breaks market structure the way a working forex trader actually uses it: what it is, how uptrends and downtrends form, where beginners get trapped, and how to enter so your stop is tight and your reward makes sense.
Why market structure comes before strategy
Most new traders skip the basics. They chase advanced setups while their chart reading is still fuzzy. Then every new strategy feels hard — or they keep copying signals without understanding why price is allowed to move.
If you understand structure, you can:
- Tell uptrend vs downtrend vs “do nothing”
- Know where money is actually made (pullbacks, not chase candles)
- Place tighter stops with cleaner risk–reward
- Spot when the trend has flipped so you exit or reverse with logic, not hope
On FundedFirm Instant or challenge accounts, structure keeps you from the classic kill shot: buying the spike, wide stop, pullback tags you out, then price runs without you.
The three market phases (only two are usually tradeable)
Price lives in one of three modes:
1. Uptrend (bullish structure)
Price prints higher highs (HH) and higher lows (HL). Buyers are in control. You look to buy weakness (pullbacks), not every green candle at the top.
2. Downtrend (bearish structure)
Price prints lower highs (LH) and lower lows (LL). Sellers are in control. You look to sell strength (rallies into resistance / lower highs), not panic-sell the bottom of a flush.
3. Sideways / range / non-directional
Price chops between support and resistance. No clean HH–HL or LH–LL sequence. Many traders call this consolidation or a “sideways market.”
For beginners: stand aside or trade the range edges only if that is your plan. Structure-based trend trading works best when the market is actually trending.
Uptrend psychology: how higher highs and higher lows are born
Forget the labels for a second. Watch the story.
Point A → Point B
Buyers push price up from A to B. At B, something resists: prior high, round number, supply, Fib. Buying pressure weakens. Early longs take profit. Sellers lean in.
The pullback
Price drops. It often finds a “reason” to pause — Fib (often around 50%), prior support, round number, or a demand zone.
Missed buyers step in
Traders who missed the first leg see the bounce and buy. Sellers who sold at B still have stops above that swing.
Stops fuel the next leg
When price pushes through B, those stops get hit. That fuel helps create the next push higher. A new higher high forms.
The pattern repeats
Profit-taking → pullback → higher low → break of the last high → another higher high.
Name the swings correctly:
| Swing | Meaning in an uptrend |
|---|---|
| Higher high (HH) | New peak above the last peak |
| Higher low (HL) | Pullback low that stays above the previous low |
As long as lows keep rising and highs keep breaking higher, the bullish structure is intact. Your job is not to buy every breakout candle — it is to buy where the structure says buyers are defending.
Downtrend psychology: why price never falls in a perfect 90° line
Markets need liquidity and opposing orders. A vertical drop leaves no fuel. So downtrends also breathe.
- Sellers drive a leg lower.
- Profit-taking and short covering create a bounce (lower high).
- Fresh buyers try support; sellers sell that bounce.
- Price breaks the prior swing low — stops under that low add fuel.
- A new lower low prints. The cycle repeats: LH → LL → LH → LL.
Name the swings correctly:
| Swing | Meaning in a downtrend |
|---|---|
| Lower high (LH) | Rally peak below the previous peak |
| Lower low (LL) | New trough below the previous trough |
Until a meaningful break of that sequence happens, you trade with the sellers — preferably at lower highs, not after price has already collapsed.
Trendlines: structure drawn as a line
Join the meaningful swing points:
- Uptrend: connect rising lows (at least two; three makes it stronger).
- Downtrend: connect falling highs.
That line often acts like dynamic support/resistance. Many “tiny stop” trades come from buying/selling into that line — not from chasing a breakout with a stop halfway across the chart.
The #1 beginner mistake: buying the vertical breakout
This is where accounts — personal and funded — get hurt.
What it looks like
Resistance consolidates. Price breaks out hard, almost vertical. Chat says: “Buy here! Buy the break!”
Why that entry is often wrong
A near-90° rally usually means heavy buying already happened. A pullback is due. If you buy the spike:
- Stop goes under a distant swing → huge risk
- Waiting for “confirmation” closes → you enter even higher → RR destroyed
- Pullback tags your stop
- Then structure continues with a higher high — without you
You were not “wrong about direction.” You were wrong about location.
What to do instead
- Draw the trendline / mark the last higher low.
- Prefer entries at:
- Higher low / support
- Trendline touch
- The third swing after two clear swings (often the cleanest, tightest stop)
- Place the stop just beyond the structure point that invalidates the idea — that is how traders keep stops small without gambling.
Rule of thumb: In an uptrend, money is made buying lower points (higher lows) — not buying the scream at the high. In a downtrend, money is made selling lower highs — not shorting the flush at the low.
Real-chart thinking: breakout trap → structure flip → patient short
Walk through a common live sequence (same logic on forex pairs as on indices):
- Market is making higher lows; bullish structure is fine.
- A breakout of the recent high looks “confirmed.” Traders long there with wide stops.
- That high was a trap / weak break. Pullback is deeper than expected. Stops get hit.
- Price breaks the rising structure. Higher highs flip toward lower highs — bearish shift.
- Pros do not short the first panic candle. They wait for a pullback into resistance / lower high, then short with a stop above that LH and targets toward the next lows.
- They hold while LH–LL continues. They look to exit when structure breaks back — e.g. a break of the descending trendline / shift back toward higher highs.
Same mistake in reverse on breakdowns: people short the support break, get caught in short covering, see a W-style bounce, and get stopped — when waiting for a lower high would have given a cleaner short and a chance for the pullback to fail into their target.
If your stop keeps getting hit “right before it works,” check location first — not your indicator.
Where to enter (cheat sheet)
In an uptrend
- Buy higher lows, demand, or rising trendline
- Avoid chasing HH breakouts after parabolic moves
- Invalidation: decisive break and acceptance below the last HL / trendline
In a downtrend
- Sell lower highs, supply, or falling trendline
- Avoid shorting LL breakdowns into exhaustion without a LH
- Invalidation: break and acceptance above the last LH / trendline
In a range
- Either skip, or fade clear edges with tight risk
- Do not force “trend structure” entries in chop
How long do you hold the trade?
Hold while your structure is intact.
- Long: hold while HL–HH sequence (or rising trendline) holds
- Short: hold while LH–LL sequence (or falling trendline) holds
Exit or flip when structure clearly breaks — not because a random candle scared you. That one habit alone upgrades both discretionary trading and funded-account discipline: you stop cutting winners for noise and stop holding losers after the story has already changed.
Market structure on a FundedFirm account
Prop rules punish bad location twice: wide stops burn daily/overall loss limits, and revenge re-entries after breakout traps stack violations. Structure fixes the root:
- You wait for HL / LH / trendline instead of FOMO breakouts
- Stops sit at logical invalidation, so risk is planned
- You know when the bias flipped, so you stop fighting the new structure
Whether you trade forex on MT5 with an Instant funded account or a challenge path, the chart still asks the same question: Are we making higher highs and higher lows, lower highs and lower lows, or going nowhere?
Quick checklist before every entry
- Phase? Uptrend / downtrend / range
- Last two swings labeled? HH–HL or LH–LL
- Am I buying a high or a higher low? Selling a low or a lower high?
- Is this a vertical breakout that still owes a pullback?
- Where is invalidation — and is RR still worth it after confirmation?
- What structure break takes me out of the trade?
If you cannot answer those in 30 seconds, you are guessing.
Key takeaways
- Market structure is the foundation — learn it before stacking advanced tactics.
- Uptrend = HH + HL. Downtrend = LH + LL. Range = often no trade.
- Trends breathe (pullbacks). Vertical moves usually owe a pullback.
- Beginners lose by buying breakouts / shorting breakdowns with huge stops.
- Pros buy higher lows and sell lower highs, often with trendline context.
- When structure flips, wait for the pullback into the new bias — don’t chase the first spike.
- On a funded account, structure is not theory; it is how you keep risk small and payouts possible.
Master this, and every support/resistance, Fib, and breakout lesson finally has a home on the chart. Until then, you are trading candles. After this, you are trading who is in control — and where they are likely to defend next.