


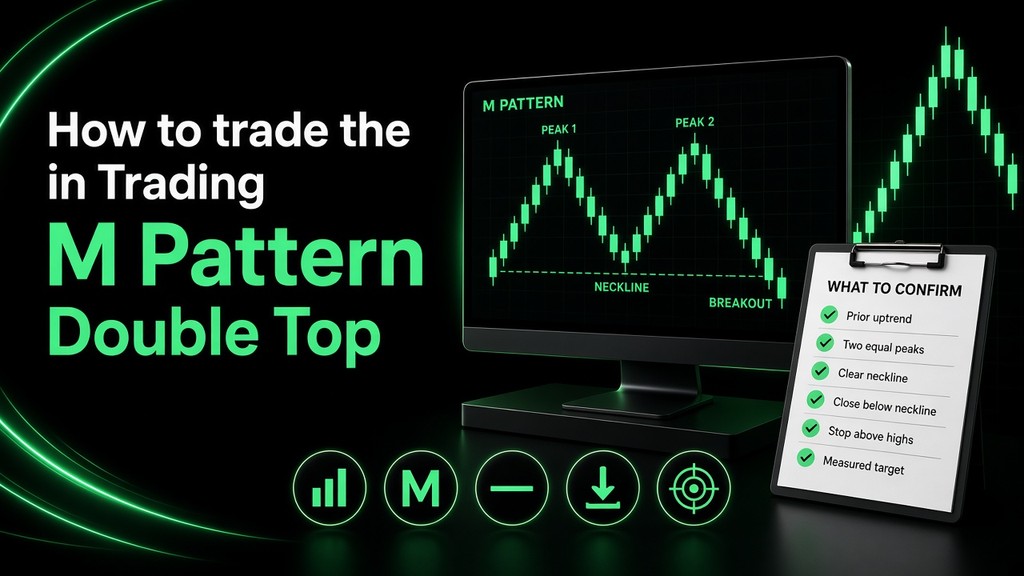
The M pattern in trading is a bearish reversal formation that appears after an uptrend. Price prints two highs near the same level, pulls back between them, and then breaks the low that sits between those highs. Traders also call this formation a double top. The letter M is simply the shape those swings leave on the chart.
A shape alone is not a trade. A valid M pattern needs a prior uptrend, two rejected highs, a clear neckline, and a break of that neckline. Used with structure, momentum, and a fixed risk plan, M pattern trading gives forex and index traders a repeatable way to sell a market that has stopped making higher highs.
This guide covers how the pattern forms, how to tell a real one from a lookalike, where to enter, where to place the stop, how to set the target, and how to size the trade so one failed setup cannot wreck a funded evaluation.
What Is the M Pattern in Trading?
An M pattern is a two-swing top. Buyers push price to a high, sellers pull it back, buyers try again and fail to clear that high, and sellers then drive price through the pullback low.
Four parts define it:
- Prior uptrend. The pattern is a reversal. It needs a rally to reverse.
- First peak. Buying climaxes and price stalls at resistance.
- Neckline. The swing low between the two peaks. This is the trigger level.
- Second peak. A retest of the same resistance zone that fails to break out and hold.
The pattern is complete when price closes below the neckline. The second peak is a warning. The neckline break is the signal.
On a forex chart the two peaks rarely print the exact same price. Treat the highs as a zone, not a single pip. On majors, a second high that stalls inside a tight band around the first high is enough, provided the rejection is obvious and the neckline is clean.
Why Traders Call This an M Chart Pattern
The name is visual. Rise, fall, rise, fall. Connect the swings and the path looks like a capital M. That is why searchers use M chart pattern, M pattern, and double top for the same idea.
The double-top label is the classical charting name. The M label is the nickname. Both describe one structure:
| Name you will see | What it means |
| M pattern / M chart pattern | Visual nickname for the two-peak top |
| Double top | Textbook name for the same formation |
| Neckline | Low between the two peaks; break confirms it |
| Measured move | Height of the M, projected down from the neckline |
Do not confuse it with a head and shoulders top. A head and shoulders has three peaks, and the middle peak is the highest. An M pattern has two peaks at roughly the same height.
Anatomy of a Valid M Pattern
Mark these levels before you think about a short.
Left leg. The rally into the first peak should be a real swing, not a two-candle spike in a range. On the daily chart, several sessions of higher highs are a healthier base than a single news candle.
Peak one. Often the more emotional high. In markets where volume is meaningful (indices, gold, stocks), the first peak frequently prints heavier volume than the second. In spot forex, use tick volume only as a secondary clue. Broker volume is not exchange volume.
Pullback. Price must retreat far enough to create a neckline you can draw without guessing. A tiny dip between two highs is noise. A pullback that gives back a meaningful slice of the prior rally creates a level worth trading.
Peak two. Price returns to the first high and fails. Failure can be a lower high, an equal high, or a brief pierce that closes back inside the zone. A strong close well above peak one cancels the idea. That is a breakout, not a double top.
Neckline break. A candle close beyond the neckline. A wick through the level is a probe. In liquid forex pairs, many traders wait for the candle of their trading timeframe to close below the line before they count the pattern as active.
Symmetry. The two peaks should be comparable in height. The time between them should be long enough for a real second auction. On a 15-minute chart that can be a few hours. On a daily chart it is often one to several weeks. A second peak that prints three candles later is usually just a pause.
A practical filter many discretionary traders use: if you have to squint to see the M, it is not clean enough to risk evaluation capital.
The Psychology Behind M Pattern Trading
The pattern maps a shift from buyer control to seller control.
- Into peak one, the trend is intact. Dips are bought. Late buyers chase the high.
- The pullback is the first sign that supply showed up. Early longs take profit. New sellers test the market.
- Into peak two, buyers get a second chance. If they cannot print a higher high and hold it, the narrative changes. Stops from breakout buyers often sit just above peak one. When price fails there, those buyers are trapped.
- Through the neckline, the last buyers who defended the pullback are wrong. Their stops sit under that low. The break triggers those stops and pulls in fresh shorts. That is why the neckline break often accelerates.
The second peak is where confidence fades. The neckline is where positioning flips. Trading the fade in confidence before the flip is an aggressive trade. Trading the flip is the confirmation trade.
How to Identify an M Chart Pattern
Use this checklist on every candidate. All five should be true before the setup is tradable.
- Trend. Price has been making higher highs and higher lows on the timeframe you are trading, or it has rallied hard into a known higher-timeframe supply zone.
- Two rejections. Both peaks stall in the same price zone. The second peak does not close and hold above the first.
- A real neckline. The trough between the peaks is a swing low you can mark with a horizontal line. Intermediate candles do not chop through it repeatedly before the actual break.
- Confirmation. The signal candle closes below the neckline on your execution timeframe.
- Room to the target. The measured-move target, or the next support, is far enough away that the trade can pay at least 1:1.5 after spread and stop distance. If support sits immediately under the neckline, the short has nowhere to go.
Extra filters that improve selectivity:
- Higher-timeframe location. An M pattern into weekly or daily resistance is stronger than an M pattern in the middle of a range.
- Momentum disagreement. RSI or MACD makes a lower high while price makes an equal high. That bearish divergence supports the idea that the second push is weaker.
- Candle quality at peak two. Pin bars, bearish engulfing candles, or a failed breakout close back under resistance are cleaner than a slow drift.
- Session. On EURUSD, GBPUSD, and gold, the London and New York overlap produces cleaner breaks than the late Asian session.
Invalid patterns share a few signatures: no prior trend, peaks far apart in price, a neckline you keep redrawing, or a break that immediately closes back above the line.
M Pattern Variations Worth Knowing
Classic double top. Two sharp peaks, similar height, clean neckline. This is the standard M chart pattern.
Adam and Eve. Chart researchers, including Thomas Bulkowski, split double tops by peak shape. Adam peak is narrow and spiky. An Eve peak is wider and rounded. You can see Adam-Adam, Adam-Eve, or Eve-Adam combinations. The trade plan does not change: short the neckline break, invalidate above the highs. Eve peaks often mark a longer distribution, which can mean a slower break and a retest.
Pierced second peak. Price spikes above peak one and closes back below it. That sweep often grabs buy stops before the real reversal. It is still an M pattern if the close fails and the neckline later breaks. Put the stop beyond the spike high, not beyond the first peak only.
Complex top. Three or more pushes into the same ceiling. If the middle push is clearly the highest, label it a head and shoulders. If the pushes are similar in height, treat it as a range top and still require a neckline or range-low break.
Failed M. Price breaks the neckline, then reclaims it and closes back above. That failure is information. The bearish idea is invalid. Chasing the short after a reclaim is how traders turn one small loss into a large one.
Best Timeframes and Markets
The pattern is timeframe-agnostic. The rules scale. What changes is noise, target size, and how long you are in the trade.
| Style | Chart for the pattern | Chart for entry | Typical hold |
| Swing | Daily | H4 or Daily close | Days to a few weeks |
| Intraday swing | H4 | H1 close or neckline retest | Several hours to a few days |
| Day trade | H1 or M15 | M15 or M5 close | Minutes to hours |
A reliable workflow:
- Read Daily for trend and major supply.
- Mark the M pattern on H4 if you swing trade, or H1 if you day trade.
- Execute on the next lower timeframe only to refine the entry. Do not hunt M patterns on M1. The structure is too noisy, and the target is usually smaller than the spread plus the stop.
The pattern shows up on forex majors, gold, indices, and crypto. Majors and gold tend to respect the neckline more cleanly during London and New York. Exotic pairs and thin crypto books produce more false breaks. If you trade those markets, demand a close and a retest, and cut size.
How to Trade the M Pattern: Three Entries
Pick one entry and write it down. Mixing them mid-trade is how plans fall apart.
1. Confirmation break
Sell when the execution candle closes below the neckline.
- Why traders use it: The pattern is complete. You are not guessing that peak two will hold.
- Cost: Price has already moved. Your stop, measured from the second peak, is wider relative to remaining target.
- Best for: Evaluations where you would rather miss a trade than anticipate one.
2. Neckline retest
After the break, wait for price to return to the neckline from below and reject it. Old support becomes new resistance.
- Why traders use it: Entry is closer to invalidation, so the stop can be tighter and the reward larger.
- Cost: Strong breakdowns never retest. You will miss some of the best moves.
- Best for: Patient swing traders, and anyone whose daily loss limit cannot absorb a wide stop.
A valid retest shows rejection: a bearish close, a wick into the neckline that fails, or a lower-timeframe M pattern inside the retest. A lazy drift back through the neckline is a warning that the break is failing.
3. Aggressive entry at peak two
Sell on the rejection candle at the second high, before the neckline breaks.
- Why traders use it: Best price, tightest stop (just beyond the high).
- Cost: Highest failure rate. Peak two can still break out. The pattern is not confirmed.
- Best for: Experienced traders who size this attempt smaller than a confirmed break, and who accept that many of these shorts never become M patterns.
For most traders building a record on a funded account, the confirmation break or the retest is the professional default. The aggressive entry is a separate strategy with its own statistics. Do not call it the same setup.
Order type. A stop order under the neckline gets you in, but it also gets you in on a wick. A market order after the candle close is slower and cleaner. On MT5, pending sells are useful for the retest: a limit sell at the underside of the neckline, cancelled if price closes back above it.
Where to Put the Stop-Loss
The stop belongs where the idea is wrong.
Beyond the second peak. If price trades back above that high and closes there, the double top has failed. This is the logical stop for a confirmed short. Add a small buffer for spread and noise. On EURUSD, a few pips beyond the high is enough. On gold and indices, use a buffer tied to recent volatility, such as a fraction of ATR(14), so a normal wick does not tag you.
Beyond the whole resistance zone. If the two peaks differ by a handful of pips, one stop above the higher of the two highs covers both. Use this when peak two spiked above peak one.
Tighter structural stop. After a break-and-retest entry, some traders place the stop above the retest swing rather than above the original peaks. The risk is smaller. The trade is also easier to shake out. Only do this if the retest rejection is obvious and the smaller risk still fits your percentage rules.
Avoid two habits:
- A stop a few pips under the neckline “to be safe.” That is inside the noise of the level you just sold.
- Moving the stop farther away because the trade went against you. If the high breaks, exit. The pattern is over.
Profit Targets
Measured move. Measure the vertical distance from the peak zone to the neckline. Project that same distance below the neckline. If the M is 80 pips tall, the classic objective is about 80 pips under the break. This is a planning tool, not a promise. Scale it only when the path down is clear.
Structure first. If a daily support, prior swing low, or round number sits inside the measured move, take at least part of the position there. A measured target through a major floor is a hope.
Partials. A simple funded-account approach:
- First portion off at 1R (one times your initial risk) or at the nearest support.
- Move the stop to breakeven only after price has left the neckline and structure has shifted, not the moment you are one pip in profit.
- Leave the rest for the measured move or the next higher-timeframe demand zone.
Minimum pay. If the distance to the first realistic target is smaller than 1.5 times the stop distance, skip the trade. Spread, slippage, and a daily loss limit make low-payoff M patterns a poor use of risk.
Confirmation That Filters Bad M Patterns
Stack two or three of these. More than that and you will never trade.
- Close, not wick. The signal is a candle close beyond the neckline on the timeframe where you marked the pattern.
- Bearish divergence. RSI or MACD prints a lower high at peak two while price prints an equal high. Divergence supports the short. It does not replace the neckline break.
- Moving-average context. Price is extended above the 50- or 200-period average and the M pattern forms at that extension. An M pattern that forms while price is already below a falling 200-period average may be late.
- Break of structure. On the lower timeframe, the neckline break also takes out the last higher low. You want the short to agree with structure, not fight it.
- Failed breakout. Peak two trades above peak one and immediately closes back inside. That trap is one of the cleaner versions of the pattern.
- Volume or tick-volume expansion on the breakdown candle. Treat forex tick volume as a tie-breaker only.
Skip the trade when the higher timeframe is in a powerful uptrend and your M pattern is a small H1 wiggle against that trend. Countertrend M patterns can work. They deserve half the size, or they deserve to be passed.
M Pattern and W Pattern
These are mirror formations.
| M pattern (double top) | W pattern (double bottom) | |
| Bias | Bearish | Bullish |
| Needs | An uptrend into the pattern | A downtrend into the pattern |
| Shape | Two highs, one neckline low | Two lows, one neckline high |
| Confirmation | Close below the neckline | Close above the neckline |
| Stop idea | Above the peaks | Below the troughs |
| Target idea | Measured move down | Measured move up |
| What it suggests | Sellers have absorbed the second rally | Buyers have absorbed the second selloff |
The execution rules are the same. Only the direction changes. Traders who can read one can read the other. The mistake is trading an M pattern in a downtrend or a W pattern in an uptrend and calling it a reversal. In a downtrend, two similar highs are often just a bear flag or a pause.
M Pattern and Head and Shoulders
Both are bearish reversal structures. The difference is the middle.
- M pattern: two peaks, similar price, neckline at the middle trough.
- Head and shoulders: left shoulder, higher head, right shoulder. The neckline connects the two reaction lows.
Trade management rhymes. Confirm on a neckline close, stop beyond the right-hand high, target from the height of the pattern. Label the pattern correctly so your neckline is drawn on the right swings. Forcing an M label onto a three-peak top leads to a neckline in the wrong place and a stop in the wrong place.
A Worked Example
This is a teaching sketch, not a live signal.
Assume EURUSD has rallied for two weeks on the H4 chart.
- Peak one prints at 1.1000.
- Price pulls back to 1.0940. That low is the neckline. Pattern height is 60 pips.
- Peak two stalls at 1.0992 and closes back down. A bearish engulfing candle forms. RSI makes a lower high.
- The next H4 candle closes at 1.0932, under the neckline.
Confirmation entry: sell at 1.0932.
Stop: 1.1008, a few pips above the higher peak (1.1000). Risk is about 76 pips.
Measured target: 1.0940 minus 60 pips = 1.0880.
Reward: about 52 pips. That is under 1:1.
A professional trader does not force this one. The stop is wider than the target because the sell came late in a 60-pip pattern. Two adjustments fix the math:
- Wait for a retest of 1.0940 and sell a rejection at 1.0938 with the same stop at 1.1008 only if you can justify the risk. Often the retest allows a stop above the retest high instead, for example 1.0955. Risk then shrinks to about 17 pips, and 1.0880 becomes a multiple of risk.
- Or skip it and wait for a taller H4 or Daily M pattern, where the height is large relative to the buffer above the peaks.
The lesson: a textbook M pattern can still be a bad trade if the stop-to-target ratio is poor. Pattern recognition and trade selection are separate skills.
Using the M Pattern in a Funded Evaluation
Pattern skill does not pass a challenge. Loss control does. An M pattern short has to fit the account rules before it fits the chart.
On a FundedFirm 1 Step account, the published limits include a 10% profit target, a 3% maximum daily loss, a 6% maximum overall loss, and 3 minimum profitable days before a reward, with a profit split of up to 100%. News trading is allowed. Accounts run on MT5, from $5,000 to $100,000. Other programs (2 Step, Instant) use their own targets and loss limits. Read the rules on the account you buy. They are the strategy.
How that changes M pattern trading:
- Risk a fraction of the daily loss, not the whole thing. If the daily limit is 3%, risking 0.5% to 1% on one M pattern leaves room for spread, a second attempt, and a mistake. One full-risk short that runs to a wide stop can end the day even when the idea was valid.
- Pre-define the pip value. Decide the stop in pips first, then calculate lot size so the loss at that stop equals your chosen percent. Do not choose the lot size first.
- Count floating loss. Daily loss on these accounts includes open loss. A short that is not yet at the stop still counts. A wide-stop swing M pattern can breach a daily limit before the pattern invalidates. If the correct stop is too far for the daily limit, the trade is too big or the timeframe is too high for that account. Drop size or pass.
- News is allowed, and it still distorts patterns. An M pattern that completes into a high-impact release can break the neckline on a spike and reverse. You may hold through news. You should still know when the release is, and you should decide in advance whether this pattern is one you want live during it.
- Give winners time to become profitable days. A funded path that requires profitable days rewards traders who take the planned target, not traders who scratch every winner at +2 pips. Partials at structure, runner toward the measured move.
- Journal the pattern type. Tag each trade as break, retest, or aggressive peak-two entry. After 30 samples you will see which entry actually pays on your pairs. That record is worth more than another indicator.
FundedFirm’s no-time-limit style of evaluation suits this pattern. Daily and H4 M patterns need time to build. You can wait for the neckline close instead of forcing a short because a clock is running out.
Mistakes That Ruin the Setup
Trading every M-shaped wiggle. Ranges produce M shapes all day. Without a prior swing up into resistance, it is a range, not a reversal.
Entering on peak two and calling it confirmed. Confirmation is the neckline. Until then you are fading resistance. That can be a strategy. It is a different strategy.
Redrawing the neckline to justify a fill. The neckline is the lowest point between the two peaks, or the clear horizontal shelf if several candles share that low. If you move it after the fact, you are fitting the pattern to the trade.
Ignoring the higher timeframe. A beautiful M15 M pattern directly under a Daily breakout level is a pullback in an uptrend until the Daily says otherwise.
Stops inside the structure. Stops between the neckline and the peaks get harvested by the retest, which is a normal part of a healthy break.
No target before entry. If you cannot point to the measured move and the next support, you cannot know whether the trade pays.
Adding to a loser. A second peak that “almost” held is not a reason to increase size. Invalidation is the high. Past that, you are out.
Position size that ignores the daily loss. A correct pattern with an oversized lot is still a rule breach if the stop, or the floating loss on the way to the stop, exceeds the account limit.
Pre-Trade Checklist
Before you send the order, answer yes to each line.
- Higher-timeframe trend or supply zone supports a short.
- Two peaks reject the same zone.
- Neckline is drawn from the real swing low between them.
- Signal candle has closed beyond the neckline, or the retest has rejected.
- Stop is beyond the pattern high, with a volatility buffer.
- Target is at least 1.5R to the first realistic support or the measured move.
- Lot size risks a pre-set percent and cannot breach the daily loss by itself.
- You know the next high-impact event.
- You have written whether this is a break entry or a retest entry.
If any line is a no, there is no trade. The next M pattern is already forming somewhere else.
Frequently Asked Questions
What is the M pattern in trading?
The M pattern in trading is a bearish double top. After an uptrend, price makes two highs near the same level and then breaks the low between them. That neckline break is the standard confirmation that buyers have failed and a downside move can develop.
Is the M pattern the same as a double top?
Yes. M pattern, M chart pattern, and double top are three names for one formation. Traders use the letter M because the two peaks and the middle trough draw that shape.
What confirms M pattern trading?
A candle close below the neckline on the timeframe where you identified the pattern. A wick through the neckline is not enough. Many traders then prefer a retest of the neckline from below before they sell.
Where does the stop go on an M chart pattern?
Above the higher of the two peaks, plus a small buffer for spread and noise. If price accepts above that high, the reversal idea is wrong and the short should be closed.
How is the M pattern target calculated?
Measure the height from the peaks to the neckline and project it downward from the breakout. Take profits earlier if a strong support level sits inside that distance.
Does the M pattern work in forex?
It appears regularly on forex majors, gold, and indices. It is more reliable when it forms at higher-timeframe resistance, on H1 charts and above, and when the neckline close agrees with momentum. It fails often enough that risk per trade has to stay small.
Can I use the M pattern on a prop firm account?
Yes, if the stop distance and lot size fit the daily and overall loss limits. A valid pattern that risks more than the daily loss allows is not a valid funded trade. On FundedFirm, check the loss limits for your specific program and size the short from the stop inward.
What is the difference between an M pattern and a W pattern?
The M pattern is a bearish double top after an uptrend and confirms on a break below the neckline. The W pattern is a bullish double bottom after a downtrend and confirms on a break above its neckline.
Final Thoughts
The M pattern in trading is one of the clearest ways to see a trend lose its ability to make higher highs. The work is in the filters: a real prior rally, two highs in the same zone, a neckline you do not have to invent, and a close that breaks it. The trade is only worth taking when the stop sits beyond the high and the target still pays.
Treat M pattern trading as a process you can journal, not a shape you chase. Mark the levels, choose break or retest in advance, size the position to the account rules, and let the neckline decide. Traders who do that on MT5, with the daily loss limit respected on every attempt, give this classic reversal a fair chance to compound. Traders who short every M-shaped pullback spend the evaluation proving why confirmation exists.
Educational content only. Trading leveraged markets involves a substantial risk of loss. Nothing here is investment advice or a recommendation to buy or sell any instrument. Challenge rules, profit splits, and loss limits change; confirm the current terms on FundedFirm before you purchase an evaluation. Past patterns do not predict future results.