


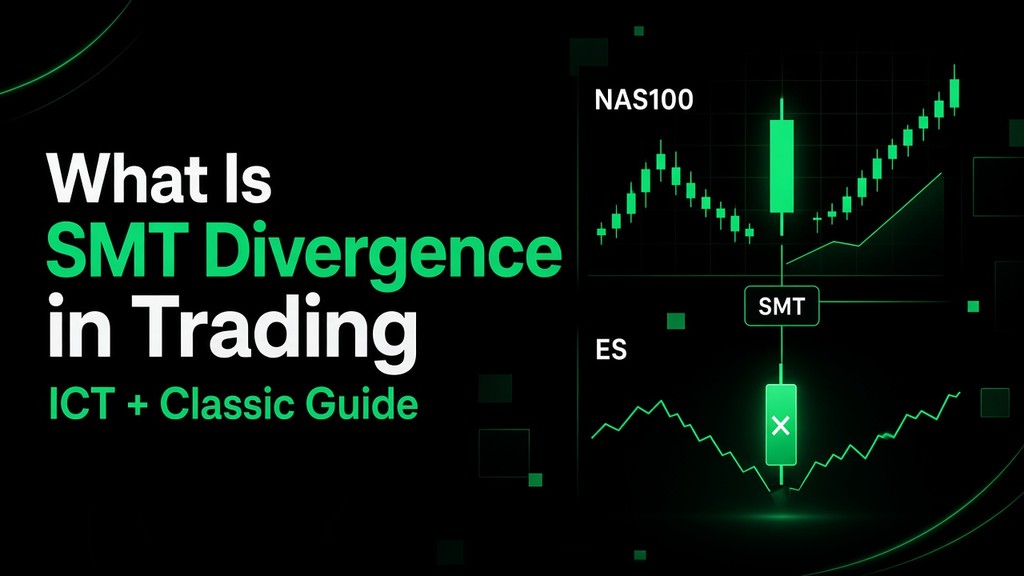
Divergence in trading is the moment price and a confirming signal stop agreeing. Classic traders compare price with RSI, MACD, or Stochastic. ICT traders also compare two correlated markets. That second method is SMT divergence.
So, what is SMT divergence in trading? It is a failure swing between related assets: one market prints a new high or low, and the correlated market does not. In SMT divergence ICT trading, that mismatch is treated as a clue that liquidity was taken on one side while the other market refused to confirm, often before a shift in delivery.
This guide covers divergence trading from both angles: regular and hidden indicator divergence, how SMT is marked, how it fits a full ICT setup, confirmation rules, worked examples, and how to size the idea so a FundedFirm daily or overall loss limit is not spent on an early entry.
Rules differ by account. Confirm your plan on the Trading Rules page and the challenge pricing table before you trade.
What Is Divergence in Trading?
Divergence in trading means price moves one way while a momentum reading, or a related market, moves another way. The chart looks strong or weak on the surface. The confirming signal does not agree.
Classic examples
- Price makes higher highs; RSI or MACD makes lower highs → bearish divergence
- Price makes lower lows; RSI or MACD makes higher lows → bullish divergence
Trading divergence is useful because trends often die from the inside. Price can keep printing extremes while the force behind those extremes fades. Divergence is how you see that fade early.
It is still only a warning. Strong trends can ignore divergence trading signals for many candles. The edge is not “see divergence, click.” The edge is “see disagreement, then wait for structure and a defined invalidation.”
Why Divergence Trading Matters
A market can climb for weeks while each new high is weaker on momentum. It can fall while each new low is less aggressive. That is the marathon-runner idea: still moving forward, energy already gone.
For discretionary traders, that early clue helps you stop chasing late breakouts and start watching for a shift. For funded traders, it matters even more. Early shorts on the first bearish RSI print can chew through a 3% or 5% daily loss before the real turn arrives.
Divergence trading earns a place in a plan when you use it as a filter:
- Higher-timeframe bias first
- Divergence at a level that already matters (liquidity, order block, previous day high/low)
- Confirmation second
- Size that survives a full stop
Without that stack, trading divergence becomes a string of countertrend scratches.
Regular Bullish Divergence
Regular bullish divergence forms when:
- Price makes a lower low
- A momentum indicator makes a higher low
Sellers still push price down. The indicator says the push is weaker than the previous one. The market is making a cheaper low with less downside momentum.
How to trade it without guessing
- Mark the two price lows and the two indicator lows on the same swings.
- Prefer the setup after a clear selloff into support, a daily discount zone, or sell-side liquidity that has already been swept.
- Wait for confirmation: a break of the most recent lower high, a bullish displacement candle, or a lower-timeframe market-structure shift.
- Stop goes beyond the divergence low. If that stop is too wide for your daily loss at a sane lot size, skip the trade.
Bullish divergence in the middle of a range, with no level under it, is usually noise.
Regular Bearish Divergence
Regular bearish divergence forms when:
- Price makes a higher high
- A momentum indicator makes a lower high
The tape looks strong. Momentum fails to confirm. Buying into that high is often the late side of the move.
How to trade it
- Connect the two highs on price and the two highs on RSI, MACD, or Stochastic.
- Prefer the setup into buy-side liquidity, equal highs, or a higher-timeframe supply zone.
- Confirm with a break of the last higher low, a bearish displacement, or a change of character on a lower timeframe.
- Stop beyond the divergence high.
Again: divergence in trading here is a risk alert. It is not an automatic short.
Hidden Divergence (Continuation)
Not every divergence is a reversal idea. Hidden divergence is often used for continuation.
| Type | Price | Indicator | Bias |
|---|---|---|---|
| Hidden bullish | Higher low | Lower low | Uptrend may continue after the pullback |
| Hidden bearish | Lower high | Higher high | Downtrend may continue after the bounce |
Simple rule
- Regular divergence → potential reversal
- Hidden divergence → potential continuation
Mixing them up is how traders short a healthy pullback in a strong uptrend. If price is making higher lows and you only see “indicator lower low,” check whether you are looking at hidden bullish continuation before you fade the trend.
Best Indicators for Classic Divergence Trading
RSI
RSI is the default tool for divergence trading because it maps momentum directly. Use swing highs and lows on RSI that match the price swings you care about. Divergences on tiny RSI wiggles inside a 5-minute chop are not the same as divergences on the daily chart into a weekly high.
MACD
MACD divergence works on the line peaks or the histogram extremes. Histogram divergence often appears earlier; line divergence is usually cleaner. Pick one method and stay consistent in the journal.
Stochastic
Stochastic helps more in ranges and mean-reversion conditions. In a strong trend, Stochastic can stay pinned and print “divergences” that never reverse. Use it when the market is oscillating, not when it is expanding.
Shared idea: these tools measure momentum. Classic trading divergence is price vs that momentum. SMT is a different comparison.
What Is SMT Divergence in Trading?
What is SMT divergence in trading?
SMT (Smart Money Technique / Smart Money Tool) divergence is an ICT concept. You do not compare price to RSI. You compare two markets that normally move together. When one prints a new extreme and the other fails to confirm that extreme, you have SMT.
| Classic indicator divergence | SMT divergence (ICT) | |
|---|---|---|
| Compare | Price vs RSI / MACD / Stochastic | Asset A vs correlated Asset B |
| Bullish idea | Price lower low, indicator higher low | Market A lower low, Market B holds a higher low |
| Bearish idea | Price higher high, indicator lower high | Market A higher high, Market B fails a higher high |
| What it suggests | Momentum is fading | Correlated liquidity / delivery is mismatched |
Example classic: EURUSD higher high, RSI lower high.
Example SMT: NAS100 new high, ES fails to make a new high.
Bullish SMT
- Choose a correlated pair (EURUSD vs GBPUSD, NAS100 vs ES, BTC vs ETH).
- Market A makes a lower low.
- Market B does not; it holds a higher low.
Traders read that as sell-side liquidity taken in A while B refuses to confirm panic. A bullish shift in A often becomes the working idea, then confirmed with structure.
Bearish SMT
- Market A makes a higher high.
- Market B fails to make a higher high.
Buy-side was run in A. B did not confirm. Distribution or a bearish delivery shift in A is the hypothesis.
Pairs that usually make sense
- Indices: NAS100 vs US30 / ES
- FX: EURUSD vs GBPUSD; AUDUSD vs NZDUSD
- Metals / risk context: XAUUSD vs a related risk pair when the session correlation is clear
- Crypto: BTC vs ETH (higher noise; still subject to firm rules)
SMT between unrelated markets is meaningless. EURUSD vs USDJPY can diverge for hours for reasons that have nothing to do with an ICT “failure swing” narrative. Stick to pairs that usually print similar swing structure.
How SMT Divergence ICT Trading Fits a Full Setup
In SMT divergence ICT trading, SMT is a layer, not the whole model. Stronger narratives usually include:
- Liquidity — equal highs/lows, previous day high/low, session extremes, stop pools
- Market structure — break of structure (BOS) or change of character (CHOCH)
- Displacement — impulsive candles that leave fair value gaps (FVGs)
- Time — London and New York killzones, when correlated indices and FX actually move together
- SMT — the correlated market fails to confirm the extreme
A practical ICT-style workflow
- Mark the key high or low and the liquidity resting beyond it.
- Watch the correlated chart for SMT at that extreme.
- Wait for a structure shift and an entry model (FVG, order block, breaker, retest).
- Place the stop beyond the invalidation swing.
- Target opposing liquidity or a clear measured objective.
If you enter on SMT alone, you are guessing which market “wins” the disagreement. The structure shift decides direction. SMT improves the location.
Worked Examples
Classic bearish RSI divergence (teaching sketch)
EURUSD, H1: price prints 1.0950, pulls back, then 1.0972. RSI peaks are 68 then 61. That is regular bearish divergence into a prior daily high.
Do not short 1.0972 because RSI said so. Wait for an H1 close that breaks the last higher low, or an M15 change of character under that low. Stop above 1.0972. If the stop is 25 pips and your daily loss only allows 15 pips of risk at your chosen percent, the setup is invalid for that account even though the divergence is real.
Bearish SMT (indices)
NAS100 prints a new session high. ES stalls below its own prior high. Buy-side is taken on Nasdaq; S&P refuses. If Nasdaq then breaks its last short-term higher low with displacement, the SMT becomes part of a short narrative. Entry is the Nasdaq structure shift or FVG, not the moment ES “looked weak.”
Bullish SMT (FX)
EURUSD sweeps a London low. GBPUSD holds a higher low. EUR took the sell stops; GBP did not confirm. A bullish CHOCH on EUR plus an FVG entry is the trade. Trading both EUR and GBP long on the same idea doubles correlated risk. On a funded account, that is how one theme becomes two hits to the daily loss.
Does Divergence Always Mean a Reversal?
No. This is the rule that saves accounts.
- Strong uptrends can print three bearish RSI divergences and keep rising.
- Bullish divergence can appear while a downtrend continues into the next liquidity pool.
- SMT can print and fail if the higher-timeframe narrative is wrong or the pair correlation breaks for the session.
Treat every form of divergence in trading as a possibility list, not a signal list. Trade it only when confirmation and risk limits agree.
How to Confirm Divergence (Classic and SMT)
- Market structure — the swing that invalidates the old trend should break on a close, not only a wick.
- Level / liquidity — divergence at a blank mid-range is weaker than divergence after a stop run.
- Candle or displacement confirmation — a real shift leaves a gap or a decisive break.
- Multi-timeframe alignment — H1 divergence against a clean daily trend is a scalp idea, not a swing idea. Size it that way.
- Risk first — write the invalidation price before the entry price.
Confirmation turns trading divergence from commentary into a plan.
Divergence Trading for FundedFirm Traders
FundedFirm allows flexible strategies, including news trading and overnight holding on many programs, but drawdown and conduct rules still apply. Use divergence as analysis. Do not use it as a reason to oversize.
Program examples (confirm live figures on the rules page):
| Account | Daily loss | Overall loss | Notes for divergence traders |
|---|---|---|---|
| 1 Step | 3% | 6% | Early fade on H1 divergence can spend the day fast |
| 2 Step | 5% | 10% | Wider buffer; still size from the stop, not the conviction |
| Instant | 3% trailing daily | 5% trailing overall (per published Instant rules) | Trailing floors punish chasing after SMT |
| Instant Daily | 3% trailing | 4% trailing + 1% open-loss cap | Wide divergence stops often fail the 1% open-loss test |
Practical rules
- Risk a fixed fraction of equity per idea, often about 0.5%–1%, so one failed divergence cannot breach the daily line.
- Do not stack EUR and GBP, or NAS100 and US30, as separate full-size bets on the same SMT story.
- Avoid revenge size after a missed turn. The next divergence is not “owed” to you.
- Copy trading is not allowed. Your SMT read has to be your own.
- Same-pair hedging and lot-size consistency rules still apply. Read the Trading Rules tab for your account.
- Floating loss counts. A divergence short that is “not stopped yet” still pressures daily equity.
Restricted Regions:
FundedFirm LTD. does not provide services for citizens/residents of the USA, Cuba, Iraq, Myanmar, North Korea, Sudan, Iran, Russia, UAE. The services of FundedFirm LTD. are not intended for distribution to, or use by, any person in any country or jurisdiction where such distribution or use would be contrary to local law or regulation.
Common Mistakes in Divergence Trading
- Trading every divergence, especially against a strong higher-timeframe trend.
- Entering too early — seeing the signal is not confirmation.
- Single-tool dependency — RSI alone, or SMT alone, with no structure.
- Wrong SMT pairs — comparing markets that do not normally swing together.
- Mixing hidden and regular — fading a trend that is only pausing.
- Oversizing on a “perfect” chart — one loss can breach a funded daily limit.
- Confusing SMT with RSI divergence — different tools; do not mix the labels in your journal.
- Doubling correlated exposure — two charts, one idea, two full risks.
Step-by-Step Divergence Trading Checklist
- Define bias on a higher timeframe.
- Mark key highs/lows, levels, and liquidity.
- Check for regular, hidden, or SMT divergence.
- Label it correctly in the journal (classic vs SMT).
- Wait for confirmation (structure / candle / displacement).
- Place the stop beyond invalidation.
- Size so a full stop cannot threaten the daily drawdown (and Instant Daily’s open-loss cap, if that is your account).
- Take profit at opposing liquidity or a planned structure target.
- Review: did the divergence lead the turn, or did you force it?
Divergence Trading vs SMT: Which Should You Use?
| If you… | Start with… |
|---|---|
| Prefer oscillators and clear indicator peaks | RSI / MACD divergence trading |
| Prefer correlated markets and ICT concepts | SMT divergence ICT trading |
| Want more than one confirmation layer | Structure + classic divergence, or structure + SMT |
You do not need both on every trade. You need one clean disagreement, one confirmation, and one risk number that fits the account.
Frequently Asked Questions
What is SMT divergence in trading?
SMT divergence in trading is when one correlated market makes a new high or low and the related market fails to make that same extreme. ICT traders use that failure swing as a clue that liquidity and delivery may be shifting, then wait for structure confirmation.
How is SMT divergence ICT trading different from RSI divergence?
RSI divergence compares price to an indicator. SMT divergence ICT trading compares two related assets. Both are forms of divergence in trading; only the second chart changes.
Is divergence trading a reversal strategy?
Regular divergence is often used for reversals. Hidden divergence is often used for continuation. Neither should be traded without confirmation.
Does SMT work on every pair?
No. Use markets that are normally correlated. Unrelated pairs will “diverge” constantly without meaning.
Can I use divergence trading on a FundedFirm account?
Yes, if the stop and lot size fit that program’s daily and overall loss limits. Divergence does not change the rules. It only changes where you look for ideas.
Final Thoughts
Divergence in trading shows when price and momentum, or two correlated markets, disagree. Classic divergence trading with RSI, MACD, or Stochastic remains a core skill. SMT divergence—especially in SMT divergence ICT trading—adds a Smart Money lens: a failure swing between related assets at a liquidity extreme.
If you keep one line from this guide:
What is SMT divergence in trading? It is a failure of one correlated market to confirm another’s new high or low—used in ICT to anticipate shifts, then confirmed with structure and risk control.
Master the definitions, wait for confirmation, and size for your FundedFirm program limits. That is how trading divergence becomes an edge instead of a series of early, oversized entries.
Review the Trading Rules, pick the challenge that matches your style, and run the checklist on demo before you pay for live evaluation pressure.
FundedFirm offers skill-based evaluations using simulated trading accounts. Trading involves risk. Past performance does not guarantee future results. Always follow the rules of your specific program.