


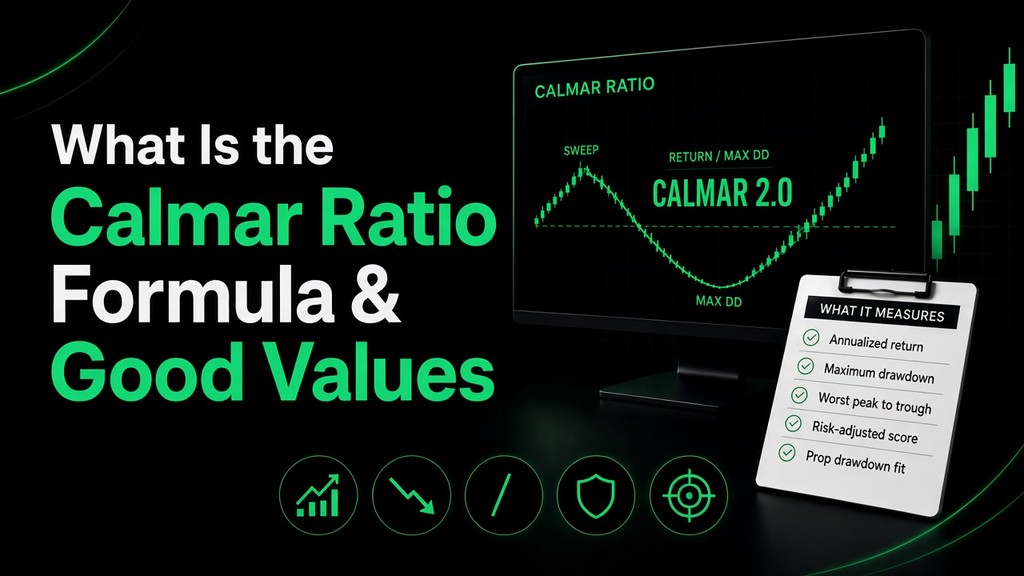
The Calmar ratio measures how much annualized return a strategy produced relative to its maximum drawdown, the single worst peak-to-trough loss in the measurement window. Terry W. Young popularized the idea through his California Managed Accounts Reports newsletter as a way to judge managed futures funds by their worst-case capital damage, not by average volatility.
For a forex or prop trader, that framing matters more than it does for a casual investor. A funded evaluation does not fail you for “volatility.” It fails you when equity crosses a daily or overall loss line. The Calmar ratio is the risk metric that speaks that language: return earned per unit of the deepest hole you dug.
This guide covers the exact formula, how to calculate maximum drawdown correctly, what counts as a good Calmar ratio, how it compares with Sharpe, Sortino, and MAR, where the three-year convention comes from, and how to apply the number to FundedFirm’s 1 Step, 2 Step, Instant, and Instant Daily rules.
What the Calmar Ratio Measures
Most risk-adjusted ratios ask a version of the same question: how much return did you earn for the risk you took? They disagree on what “risk” means.
- Sharpe treats every wobble the same. Up days and down days both inflate standard deviation.
- Sortino only penalizes downside deviation, the volatility of returns that fall below a floor.
- Calmar ignores the average wobble entirely. It looks at one number: the worst peak-to-trough decline the equity curve actually printed.
That makes Calmar a drawdown efficiency score. A Calmar of 2 means the strategy’s annualized return was twice as large as its maximum drawdown over the period you measured. A Calmar of 0.5 means the worst hole was twice the size of the annual return. The second strategy can still be “profitable” on paper and still be a poor fit for a hard overall-loss rule.
Calmar does not tell you how long the drawdown lasted, how many times you nearly breached a daily limit, or whether you recovered by skill or by one oversized winner. It answers one question cleanly: for the worst loss this track record actually took, how much yearly return did you get back?
The Calmar Ratio Formula
The standard formula is:
Calmar ratio = Annualized return ÷ Maximum drawdown
Both inputs are percentages over the same measurement window. Express the maximum drawdown as a positive number. A 12% peak-to-trough loss enters the formula as 0.12, or as 12 if the return is also in percentage points. Consistency matters more than the unit. Do not mix a decimal return with a percentage drawdown.
Example. Annualized return = 24%. Maximum drawdown = 12%.
Calmar = 24 ÷ 12 = 2.0.
Some versions subtract a risk-free rate from the return first, the way Sharpe does. That form is less common in trading practice. For a prop evaluation you are not being paid for excess return over T-bills. You are being tested on whether your equity stayed above a floor. Use the simple form unless you are comparing professional fund track records that quote the excess-return version.
If the strategy lost money over the window, annualized return is negative and Calmar is negative or undefined for ranking purposes. A losing curve does not need a Calmar score. It needs a different strategy.
How Maximum Drawdown Is Calculated
Maximum drawdown (MDD) is the largest percentage drop from an equity peak to the lowest trough that followed it, before a new peak formed.
MDD = (Peak − Trough) ÷ Peak
Use the equity high-water mark, not the starting balance alone. A strategy that climbs from $10,000 to $14,000 and then falls to $11,900 has a peak of $14,000 and a trough of $11,900.
Peak-to-trough loss in dollars = $2,100
MDD = 2,100 ÷ 14,000 = 15%
That 15% is what goes into the Calmar formula for that window, even if the account finished the year higher than $10,000. Ending the period in profit does not erase the hole. Prop firms care about the hole. So does Calmar.
Closed equity vs floating equity
This is where retail calculations go soft.
If you only sample end-of-day closed balance, you miss the open loss that would have breached a funded account at 10:00 AM. FundedFirm’s daily and overall limits count floating and closed losses. For a Calmar figure that mirrors prop reality, build the equity curve from the worst equity print you can reconstruct: balance plus open PnL, sampled at least daily, and preferably at the close of every bar on your trading timeframe.
A strategy that never closed more than 6% down, but floated to −8% on several news spikes, has an 8% maximum drawdown for any funded comparison. Using 6% will flatter the Calmar and lie to you about challenge risk.
Multiple peaks
Scan the whole window. The maximum drawdown is the worst peak-to-trough pair, not the first decline you notice. A mid-year −9% dip followed by a late −14% dip means MDD is 14%, even if the account recovered both times.
How to Calculate a Calmar Ratio Step by Step
1. Choose the window.
Convention for Calmar is 36 months. If your track record is shorter, still calculate, but label the result as provisional. A six-month Calmar of 4.0 is not the same claim as a three-year Calmar of 2.0.
2. Build the equity series.
Use daily or higher resolution. Include floating equity if you are preparing for a funded account. Export from MT5 or your journal and work in a spreadsheet.
3. Annualize the return.
If you have total return over the window, convert it to a yearly figure. For a multi-year track:
Annualized return ≈ (Ending equity ÷ Starting equity)^(1 ÷ years) − 1
For monthly returns, compound them to a yearly rate rather than averaging the months. Averaging understates a path that compounded.
4. Find maximum drawdown.
Walk the equity series. Track the running peak. At each point, compute (Peak − Equity) ÷ Peak. The largest of those values is MDD.
5. Divide.
Calmar = Annualized return ÷ MDD.
Worked example: three-year personal strategy
- Start: $10,000
- End after 3 years: $19,016
- Annualized return = (19,016 ÷ 10,000)^(1/3) − 1 ≈ 23.9%
- Worst peak was $16,000; trough after that peak was $13,600
- MDD = (16,000 − 13,600) ÷ 16,000 = 15%
- Calmar = 23.9 ÷ 15 ≈ 1.59
That is a solid, not spectacular, Calmar. The strategy made money and survived a 15% hole. Whether it fits a FundedFirm account depends on whether that 15% hole would have breached the specific overall-loss rule you plan to trade under. On a 1 Step account with a 6% overall loss, a 15% historical MDD is already a red flag. The Calmar number by itself does not clear the account rules.
Worked example: same return, different hole
Strategy A: 20% annualized, 8% MDD → Calmar = 2.5
Strategy B: 20% annualized, 20% MDD → Calmar = 1.0
Same yearly return. Completely different funded-account compatibility. Strategy A leaves room under a 10% overall-loss rule. Strategy B has already spent the entire buffer in its historical worst case, before you even begin an evaluation.
What Counts as a Good Calmar Ratio
Treat these as working benchmarks, not pass-fail grades. Asset class and strategy type change the distribution.
| Calmar (rough) | How traders usually read it |
|---|---|
| Below 0.5 | Returns do not justify the worst hole. High chance of rule pressure on a funded account. |
| 0.5 to 1.0 | Marginal. Profit exists, but the worst drawdown is still large relative to return. |
| Above 1.0 | Acceptable for many discretionary and trend strategies. Return at least matched the worst hole. |
| 1.5 to 3.0 | Strong range often cited for professional CTA and systematic track records over multi-year windows. |
| Above 3.0 | Excellent if the sample is long and the equity method is honest. On short samples, treat with suspicion. |
A high Calmar on three months of lucky trading is not a strategy. A Calmar above 1 sustained across several years, with floating equity included, is evidence of drawdown control, not just a hot streak.
Style matters:
- Trend following / managed futures often live in the moderate band. They accept periodic drawdowns to catch large moves.
- Mean reversion and short-hold strategies often post higher Calmar figures because troughs are shallower, until a regime shift produces one ugly streak.
- Buy-and-hold equity often looks weak on Calmar because a bear market can print a 30%+ MDD with no mechanism to cut risk.
- Prop-style discretionary forex should be judged against the firm’s hard limits, not against a CTA peer group. A Calmar of 1.2 with a 5% MDD is more useful for a 6% overall-loss account than a Calmar of 2.0 built on a 15% MDD.
Calmar vs Sharpe vs Sortino
All three are risk-adjusted return metrics. They are complements, not substitutes.
| Metric | Risk input | What it rewards | What it can miss |
|---|---|---|---|
| Sharpe | Standard deviation of all returns | Smooth equity with fewer large swings either way | A single severe drawdown buried inside “average” volatility |
| Sortino | Downside deviation only | Strategies that are volatile on the upside | Still averages many losing periods, not the single worst hole |
| Calmar | Maximum drawdown | Return relative to the deepest capital loss | Duration of the drawdown, number of near-breaches, path between peak and trough |
A strategy can have a strong Sharpe and a weak Calmar if most days were calm but one streak wiped 18%. That is common in trend systems that grind higher, then reverse hard. Under a prop overall-loss rule, Calmar (and the raw MDD) matter more than Sharpe.
A strategy can have a strong Calmar and a mediocre Sharpe if it has noisy day-to-day swings but never digs a deep trough. That profile can still fail a daily loss limit even when the overall MDD looks fine. Calmar alone will not catch that. You need a separate daily-loss distribution: how often equity dropped more than 2% or 3% in a single day.
Practical stack for a funded trader:
- Maximum drawdown vs the firm’s overall loss.
- Worst day vs the firm’s daily loss.
- Calmar over at least 12–36 months as a return-to-hole efficiency score.
- Sharpe or Sortino as a secondary smoothness check.
Calmar Ratio vs MAR Ratio
The MAR ratio uses the same formula: annualized return divided by maximum drawdown. The difference is the window.
- Calmar traditionally uses a trailing 36-month window. Older drawdowns eventually fall out of the sample.
- MAR usually measures from inception, so the worst hole in the entire history stays in the denominator forever.
A strategy that blew −20% five years ago and has since run clean will look better on Calmar than on MAR. Calmar is better for comparing strategies of different ages on recent footing. MAR is more conservative and harder to forget.
When you quote a number to yourself or in a journal, name the window. “Calmar 2.1 on trailing 36 months” and “MAR 1.1 since inception” are different claims. Mixing them in a comparison is one of the most common presentation tricks in strategy marketing.
Why the Three-Year Window Exists
Young’s original use case was commodity trading advisors and managed futures. A 36-month window is long enough that most strategies will have faced at least one meaningful adverse regime, yet short enough that the ratio still reflects how the manager is operating now.
Shorter windows understate risk. If your true worst drawdown has not printed yet, Calmar will look better than the strategy deserves. That is why a new six-month track with a Calmar of 5.0 is interesting and unreliable at the same time.
Longer windows can bury recent deterioration. A manager who was careful for years and reckless for the last nine months can still show an acceptable trailing three-year Calmar until the new hole grows. Always look at the recent 12-month MDD next to the 36-month Calmar.
Common Mistakes When Calculating or Reading Calmar
Using closed balance only. Prop rules count floating equity. So should your MDD.
Comparing different sample lengths. A 90-day Calmar of 3.0 is not better than a 36-month Calmar of 1.6 until the short sample survives a real stress regime.
Treating a high Calmar as a guarantee. The ratio describes what happened. It does not cap what can happen next.
Mixing Calmar and MAR. Same formula, different memory. Label the window.
Annualizing with a simple average. Use a compounded annualized return, not the average of monthly percentage gains.
Ignoring the absolute MDD. A Calmar of 2.0 built on 4% return and 2% MDD is fine for a tiny account. A Calmar of 2.0 built on 40% return and 20% MDD will breach most prop overall-loss rules even though the ratio looks identical.
Cherry-picking the start date. Starting the series after a blow-up, or ending it before one, is how marketing Calmars get manufactured. For personal use, fix the window in advance.
Limitations You Should Not Ignore
Calmar is thin by design. Two inputs cannot describe a full career.
It says nothing about time in drawdown. A −10% hole that lasted three days and a −10% hole that lasted nine months produce the same MDD and the same Calmar contribution. Your psychology and your inactivity rules care about the second case.
It can be gamed more easily than Sharpe. Stop trading after a strong run, before the next losing streak, and the reported Calmar stays high. A live evaluation does not let you freeze the clock that way for long. FundedFirm also has inactivity expectations: long stretches without trading can disable an account.
It is path-blind. Two strategies with the same peak and trough can have completely different daily-loss shapes. One never threatens a 3% daily limit. The other kisses it twice a week.
It is backward-looking. Regime change can erase a beautiful Calmar in one quarter. Use it as a filter and a journal metric, not as a certificate.
How Prop Firms and FundedFirm Rules Map to Calmar Thinking
Prop firms rarely publish a required Calmar. They publish hard equity floors. Those floors are the practical denominator of your strategy.
1 Step
- Profit target: 10%
- Maximum daily loss: 3% of the higher of day-start balance or equity, fixed for that day
- Maximum overall loss: 6% of the initial balance (equity must stay above 94%)
- Minimum trading days: 3
- News and weekend holding: allowed
- No maximum time to pass
A historical MDD of 8% already exceeds the 6% overall rule. That strategy’s Calmar is irrelevant for this account until risk is cut. Target a demo MDD well under 6%, and a worst day well under 3%, before you pay for the challenge.
2 Step
- Phase targets: 8% then 5%
- Daily loss: 5% of day-start balance or equity
- Overall loss: 10% of the initial balance
- Same three-day minimum per phase, news allowed, weekend holding allowed
The wider overall buffer tolerates strategies with a deeper historical hole than 1 Step, but a 9% MDD still leaves almost no margin for a live evaluation. Prefer a demo MDD around half the overall limit or less.
Instant
Funded with payout conditions rather than a phase target. New Instant accounts use a 3% trailing daily concept from the published Instant rules, with overall loss framed around 5% of starting balance on the rules page. Weekend holding is allowed. Payout schedules differ from Instant Daily (on-demand vs weekly splits). Check the Instant tab before you size.
Instant Daily
- Sizes: $5,000 to $18,000
- Funded day one, no profit target, account valid 30 days
- Daily: 3% trailing floor
- Overall: 4% trailing line
- Open floating loss must stay inside 1% of account size
- Stop-loss required within 1 minute; trades held at least 60 seconds
- No weekend holding
- Fixed 70% split; payout approval listed within 30 minutes, subject to the published payout conditions
Here the relevant “Calmar thinking” is extreme. An open-loss cap of 1% means many swing strategies that look fine on a three-year Calmar will breach Instant Daily on a single gold position. Calculate a separate Instant Daily Calmar only if your demo equity never violated a 1% open-loss style constraint and a 4% overall trail.
Across all programs, both floating and closed losses count. A Calmar built on closed-only equity will overstate your edge relative to these rules.
Restricted Regions:
FundedFirm LTD. does not provide services for citizens/residents of the USA, Cuba, Iraq, Myanmar, North Korea, Sudan, Iran, Russia, UAE. The services of FundedFirm LTD. are not intended for distribution to, or use by, any person in any country or jurisdiction where such distribution or use would be contrary to local law or regulation.
A Prop-Ready Calmar Workflow
Use this before you buy an evaluation, and again every month on a funded account.
- Export daily equity including floating PnL.
- Compute trailing 12-month and trailing 36-month Calmar.
- Record absolute MDD and worst single-day equity drop.
- Compare MDD to the overall-loss rule of the account you want.
- Compare worst day to the daily-loss rule.
- If either comparison fails, cut risk or change the strategy. Do not “hope the Calmar improves” inside the challenge.
- After each month live, update the series. Watch for Calmar rising because returns rose, versus Calmar rising because you simply have not drawn down yet.
Mini example against a 1 Step account
Demo results over 18 months:
- Annualized return: 28%
- MDD (floating included): 5.2%
- Calmar: 28 ÷ 5.2 ≈ 5.4
- Worst day: −2.1%
Against 1 Step (3% daily, 6% overall), the MDD fits with a little room, and the worst day fits under the daily line. The Calmar looks excellent, but the short sample means you still treat the 5.2% hole as “best case so far,” not a ceiling. Size the live challenge below demo size until the sample lengthens.
If the same return came with a 7.5% MDD, Calmar would still be about 3.7, which looks “good” on a blog table and still fails the 6% overall rule. Absolute MDD wins that argument.
How to Improve Your Calmar Ratio
You improve Calmar by raising annualized return, shrinking maximum drawdown, or both. For prop trading, shrinking the hole is usually the higher-leverage lever.
Cut risk after a losing streak. Fixed fractional risk that ignores a rising open hole is how 5% MDDs become 12% MDDs.
Hard daily stop. If the account’s daily limit is 3%, your personal daily stop should be lower, such as 1% to 1.5%, so one session cannot spend the whole buffer.
Stop averaging losers. Martingale and “adding to get out” deepen the trough that Calmar will remember forever (or for 36 months).
Avoid revenge size. The trade after a large loss is where many MDDs are set.
Reduce correlated exposure. Three EUR pairs in the same direction are often one trade. Prop rules that group same-direction entries within three minutes are formalizing that idea.
Trade fewer, higher-quality setups. A Calmar that rises because you stopped overtrading is more durable than one that rises because one month was hot.
Match the account. A weekend swing system with wide stops may show a fine Calmar on a 2 Step account and a terrible Instant Daily fit. Improving Calmar sometimes means changing the product, not only the strategy.
Improving return without watching MDD is how traders pass a demo month and breach week two of an evaluation. Funded evaluations are built to test the drawdown side of this ratio under live pressure.
Frequently Asked Questions
What is the Calmar ratio?
The Calmar ratio is annualized return divided by maximum drawdown over a measurement period, traditionally about 36 months. It shows how much yearly return a strategy produced for each unit of its worst peak-to-trough loss.
What is a good Calmar ratio?
Above 1 is generally acceptable. Many professional track records aim around 1.5 to 3 over multi-year windows. Always check the absolute maximum drawdown against your account rules. A “good” Calmar with a 15% MDD still fails a 6% overall-loss evaluation.
How do you calculate maximum drawdown for Calmar?
Find the largest percentage drop from an equity peak to the lowest trough that followed it before a new peak. For prop trading, use floating equity, not only closed balance.
Is Calmar better than Sharpe?
Neither is better in every case. Sharpe measures smoothness. Calmar measures worst-case capital loss. Under hard drawdown rules, Calmar and raw MDD are usually more relevant, while Sharpe and Sortino add context.
What is the difference between Calmar and MAR?
Same formula. Calmar usually uses a trailing three-year window. MAR usually uses the full history since inception. MAR stays anchored to old drawdowns; Calmar eventually rolls them off.
Can I use Calmar for a FundedFirm challenge?
Yes, as a pre-filter. Compare your demo MDD and worst day to the account’s overall and daily loss limits first. Then use Calmar to compare strategies that already fit those limits. Programs differ: 1 Step (3% daily / 6% overall), 2 Step (5% / 10%), Instant Daily (3% and 4% trailing, plus a 1% open-loss cap).
Does a high Calmar mean I will not blow a funded account?
No. It means your historical return was large relative to your historical worst hole. Future regimes, daily-limit spikes, and news slippage can still breach rules that Calmar never measured.
Final Thoughts
The Calmar ratio shrinks the risk conversation to the number a hard drawdown rule already cares about: how deep did the worst losing stretch go, and was the yearly return worth that depth? Used with absolute MDD, worst-day loss, and a higher-timeframe view of how long recoveries took, it becomes a practical filter for strategy selection.
Do not buy an evaluation because a spreadsheet Calmar looks pretty. Buy it when the same spreadsheet shows a maximum drawdown and a worst day that fit the specific FundedFirm account you plan to trade, with room left for floating equity and a bad fill. That is drawdown discipline measured the way the account will measure you.
Educational content only. Trading leveraged markets involves a substantial risk of loss. Nothing here is investment advice or a recommendation to buy or sell any instrument. FundedFirm programs are simulated evaluations, and payouts depend on compliance. Restricted Regions: FundedFirm LTD. does not provide services for citizens/residents of the USA, Cuba, Iraq, Myanmar, North Korea, Sudan, Iran, Russia, UAE. The services of FundedFirm LTD. are not intended for distribution to, or use by, any person in any country or jurisdiction where such distribution or use would be contrary to local law or regulation. Confirm current rules and fees on fundedfirm.com before you purchase.